Data Doesn’t Lie
Did you chicken-foot that last corner? Did you REALLY use the whole track? Was the line you tried on lap 12 actually faster or did it just FEEL faster? Data takes the guesswork out of chassis setup and driver development.
Any Data is Better than No Data
Without some sort of metric, all that’s available for feedback is driver thoughts. Sometimes that’s important but its hard to fool data. At its simplest, that’s a lap time and increased complexity means increased insights.
As I started my track-day journey, I found myself without a logger. Armed with an old phone and Matlab, I was sure that I could make something that would give me with the basics.
Remember, the only difference between science and screwing around is writing it down.
Form vs Function – Necessities
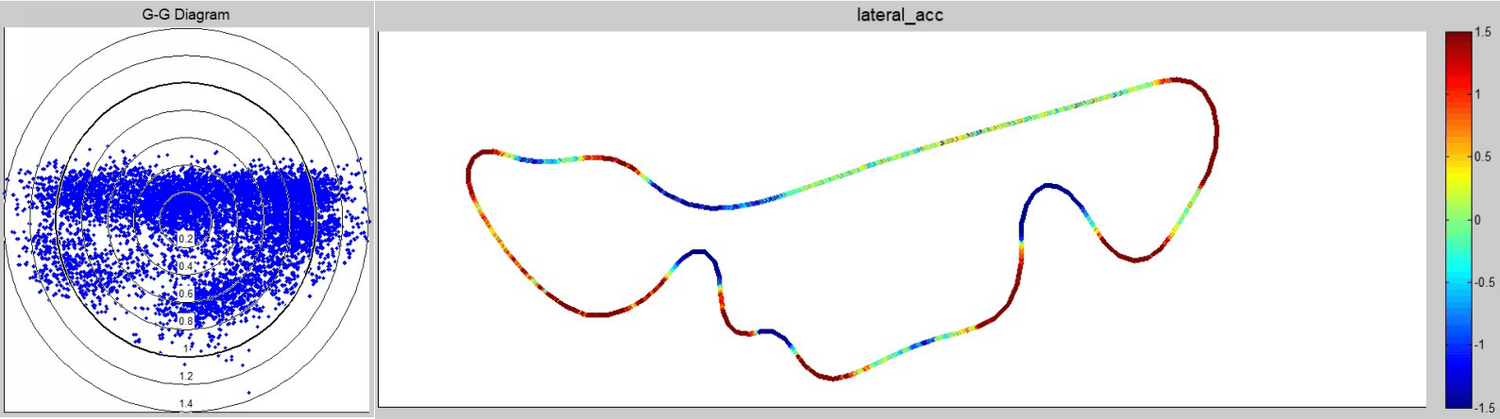
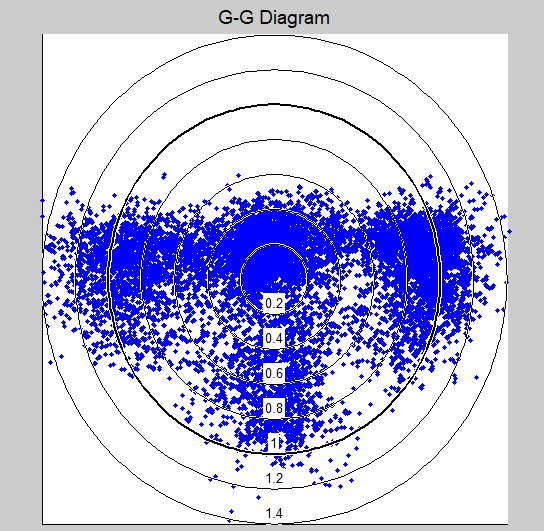
The chosen app “RaceChrono” uses the phone’s internal IMU and GPS to gather accelerations, yaws, speed, and lap times based on a library of tracks. After that, it’s up to the user to get the most out of it.
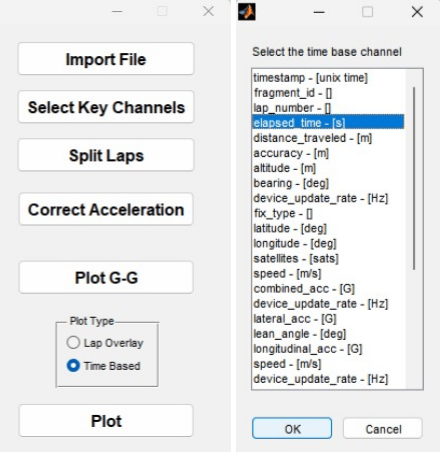
Using some albeit rusty Matlab skills, I created a custom script that loads the CSV file exported from RaceChrono and prepares it for processioning. With some additional user input, the script sets an arbitrary start/stop line, extrapolates lap data, and then finally graphs selected channel(s) in a meaningful way
Adjusting Expectations
The budget approach comes some compromises, some of which are unavoidable but with post-processing, others can be mitigated.
- Low GPS rate
- The internal GPS only functions around 10Hz. This isn’t horrible but with only approximately 1m accuracy, the ultimate track path isn’t exact and is more of a visual indicator than the actual path.
- This can be overcome in post-processing with Kalman filtering but is not used at this time
- Limited data channels
- Limited to the phone IMU channels and external data requires wireless connectivity
- User intensive post-processing
- Any data display either needs to be created through something like this MATLAB code, especially considering the large number of data points.
- No easy drag and drop, in-place ecosystem. This makes it more involved than just viewing the data
Correcting Data
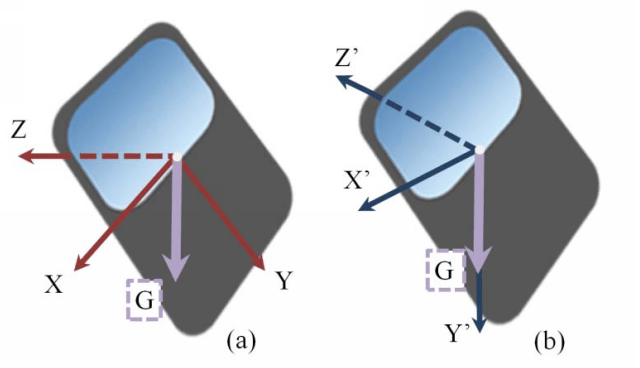
Another challenge was the phone mounting and how that relates to IMU readings. RaceChrono has an onboard calibration, but testing showed that was inconsistent. Additionally, re-calibration was required every time the phone changed position.
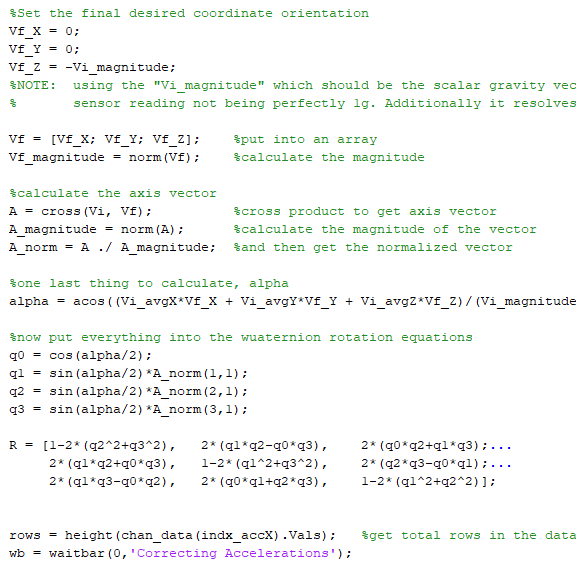
Instead, the track data plotter accounts for any difference in phone position through the assumption of a 1g (gravity) vector and establishing the “forward” vector from a straight on the track.
Using the two known vectors, a rotation matrix can be calculated to post-process the gathered IMU data. Calculating a normalized gravity vector also helps to account for any acceleration calibration inaccuracies in the phone’s IMU.
Simulation and Validation
Data gathering means little without a reference. Optimum lap was used with initial parameter estimations or quick “best guess” testing to provide a baseline:
- Vehicle configuration
- Power curve was not exactly known but data from similarly configured engines was used as an estimate
- Frontal area was roughly calculated based on a scaled image
- Drag coefficient was taken from a similar size/style vehicle: surprisingly found an estimate for a mustang “foxbody” Cd
- Tire Coefficient of Friction
- Lateral and longitudinal tire friction was estimated by measuring the “breakaway” force required for the vehicle tires, at various normal forces.
- This approach does not consider dynamic tire loading but agrees with typical estimations for a “street tire”
- Gearing
- Transmission and final drive ratios are well known and input accordingly
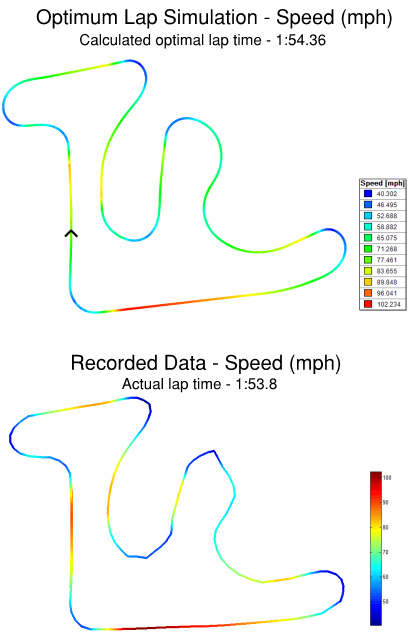
As shown at right, the gathered data was a close fit to actual recorded data. The correlation to real-world data proved the efficacy of using Optimum Lap as a baseline tool.
This exercise was not meant to verify the exact values of the data but rather to establish a relative baseline for future driver and vehicle development. Using the same tools and methods will still identify improvements and the effect of changes.
Personal Data Logging – What Next?
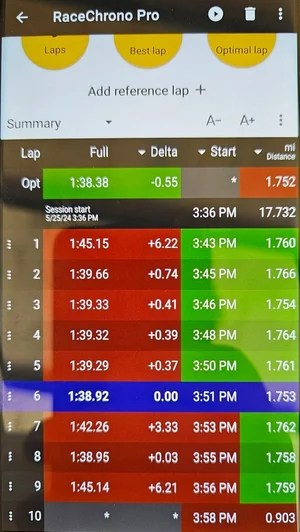
Using RaceChrono was a fantastic first step to providing basic insights for track weekends. There really is no replacement for something like the commercially available options when it comes to data integration and post-lap analysis. Future logs are being taken with an AIM Solo 2 DL, which comes with some improvements:
- Integration into the vehicle’s CANbus
- Hardwired access to engine parameters like ECT, OILP, and WBO2
- Standalone sensor bus
- The AIM loggers have sensor expansion hubs, which allows for higher-frequency logging of critical parameters.
- The sensor expansion hub allows rates up to 1kHz which is enough for basic spring and damper frequency analysis
- Improved software suite
- AIM’s Race Studio 3 is a tool I’ve used extensively in the past.
- A compiled software suite means that multiple end user devices can easily view and analyze data, without any special tools
Overall, setting up my own data analysis script was a great experience. I got an all-around refresher on matrix math, learned more about Kalman filtering, and was able to get some good initial performance data. Even if the home-made solution isn’t a long-term solution, the skills translate into the use of a commercial option. That’ll allow me to maximize track time by focusing more on the data analysis and less on the data processing.
Calspan and Tire Test Consortium Data
During college I had a fantastic opportunity with my FSAE team to talk with the folks at Calspan, and the Tire Test Consortium through Milliken Research Associates. The tire testing they do is some of the coolest application of engineering knowledge I’ve come across to date. The confluence of application of principles, interpretation of data, and analysis modeling is such a unique environment that requires a board skill-set to effectively manage.
While on the team, I was responsible for analyzing the tire data and getting our suspension design engineer the information they needed. The data provided by Calspan and the Tire Test Consortium (TTC) contained an in-depth record of rolling-road tests performed on various brands of tires at different widths and configurations. The test recorded various tires through a rigorous testing of slip angles, inclination angles, and forces provided the raw data; it was our job then to post-process that data and gain insights.
Some of the challenges included programmatically breaking the raw data into their various “runs”, filtering out noisy/not pertinent data, automatically gathering and recording average value data, fitting and smoothing raw data into a useful analysis formula, and finally the documentation and display of all the above information in a meaningful manner.

The folks at Calspan, TIRF, and Milliken Research were amazing. Everyone shared a real passion for engineering and were an invaluable resource for us young engineers. I can’t thank them enough for the support of such a great program like FSAE.
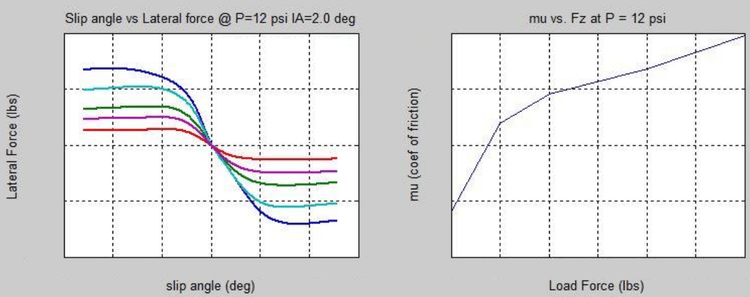
As the normal load on a tire increases, so does it’s effective lateral load. Different slip angles, inclination angles (camber), and inflated pressures cause surprisingly significant (or sometimes surprisingly insignificant) changes to performance.
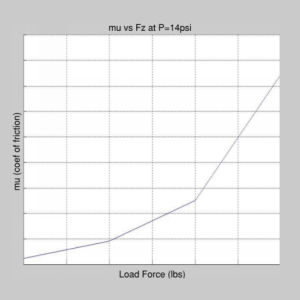
Longitudinal friction increasing as the normal force increases can be used to the drivers advantage with early, hard braking.
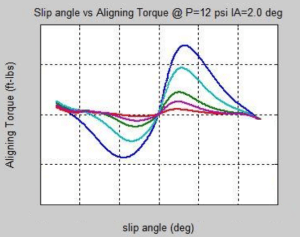
While not a direct performance metric, the self-aligning moment of the tire is important. Not enough and the car can feel vague, too much and its tiresome to drive.
